


Scope 1
(Direct emissions)
Refrigerants, generator fuel consumption, owned vehicles

Scope 2
(Indirect emissions)
Electricity

Scope 3
(Indirect emissions)
Employee commuting, linen usage, water usage, capital goods, medical supplies, food and office supplies, waste disposal
For the calculation of emission intensity, we opted for a simple and relevant metric – the total number of patients. By dividing the total emissions in kilograms of CO2 by the number of patients, we aimed to express emission intensity in terms of kilograms of CO2 per patient, offering a clear and meaningful measure of the healthcare facility’s carbon footprint per individual treated.
Insights at a Glance – Our Research Findings
Our research has uncovered compelling findings that shed light on the emission intensity landscape within ERs. The average emission intensity, a key metric in our study, has been calculated at 51 Kg CO2 per patient. Let’s delve into the individual emission intensities of each ER through the presented chart.
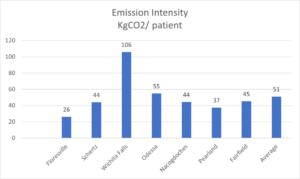
The chart vividly displays the variability in emission intensity among the seven ERs. The variations in emission intensity across all ERs arise from differences in facility size, and data variations. These key factors play a pivotal role in shaping the unique emission profiles of each emergency room. Larger facilities may inherently generate higher emissions, while data variations, stemming from diverse operational practices contribute to unique carbon impact of each ER. Understanding these variations can guide efforts to identify best practices and areas for improvement in achieving a more sustainable healthcare model.
During the calculation of emission intensities for each ER, our research also revealed significant emission hotspot. Among the various contributing factors, electricity consumption emerged as the primary source of emissions across most ERs.
From ICUs to ERs – A Comparative Analysis of Emission Intensity
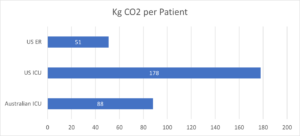
In the ever-evolving landscape of healthcare sustainability, our research takes a global stride, drawing comparisons between previous studies and our groundbreaking findings. A prior investigation into Australian and US Intensive Care Units (ICUs) investigated a per patient carbon footprint of 88 and 178 Kg respectively. In stark contrast, our study focuses on the dynamic realm of US Emergency Rooms (ERs), calculating emission intensity to reveal a remarkably lower figure – 51 Kg CO2 per patient. This comparative exploration not only underscores the diversity in healthcare practices but also prompts a closer look at the intricacies shaping emission intensity in different critical care settings across the borders. ICUs exhibit higher emissions compared to ERs due to the greater energy consumption associated with specialized machines such as ventilators, monitors, and other life support devices and constant need of HVAC system and lighting. The intricate and high-tech medical equipment in ICUs demands more energy consumption, contributing to elevated emission levels. While the ERs also have medical equipment and lighting, it does not require the same level of continuous, intensive monitoring and life support as an ICU. As a result, the emission intensity is lower.
The following chart gives a comparison between emission intensities of ER and ICUs.
Closing the Chapter – Key Takeaways
The revelations from our research provide a comprehensive understanding of the emission landscape in ERs and paving the way for targeted and impactful sustainability measures. The calculated average emission intensity of 51 Kg CO2 per patient stands as a pivotal metric, offering a standardized measure for evaluating and comparing the carbon footprint of ERs. This benchmark not only quantifies the carbon footprint but also sets the stage for the establishment of sustainable practices, guiding healthcare administrators towards measurable goals for emission reduction.
In light of the significant contribution of electricity consumption to emission intensity, exploring alternative energy sources is imperative for sustainable healthcare practices. Our recommendations involve switching to renewable energy options and integration of energy-efficient technologies, lighting, HVAC systems, and appliances that can substantially reduce electricity demand. These initiatives not only decrease the carbon footprint associated with electricity but also position ERs as champions of sustainable healthcare.
__________________________